When you buy a stock there is always a possibility that it could drop 100%. But on the bright side, you can make far more than 100% on a really good stock. One great example is T-Mobile US, Inc. (NASDAQ:TMUS) which saw its share price drive 132% higher over five years. It’s also good to see the share price up 16% over the last quarter. But this move may well have been assisted by the reasonably buoyant market (up 7.9% in 90 days).
Let’s take a look at the underlying fundamentals over the longer term, and see if they’ve been consistent with shareholder returns.
View our latest analysis for T-Mobile US
To paraphrase Benjamin Graham: Over the short term the market is a voting machine, but over the long term it’s a weighing machine. By comparing earnings per share (EPS) and share price changes over time, we can get a feel for how investor attitudes towards a company have morphed over time.
During five years of share price growth, T-Mobile US actually saw its EPS drop 11% per year.
Essentially, it doesn’t seem likely that investors are focused on EPS. Because earnings per share don’t seem to match up with the share price, we’ll take a look at other metrics instead.
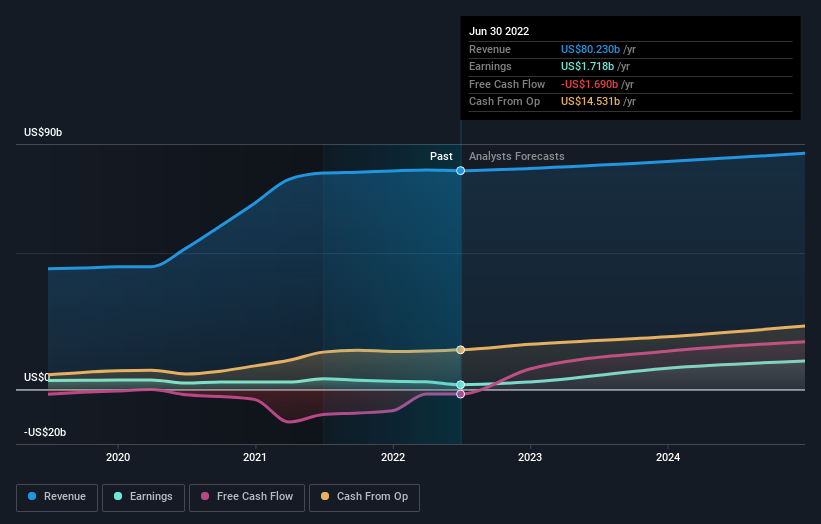
In contrast revenue growth of 18% per year is probably viewed as evidence that T-Mobile US is growing, a real positive. It’s quite possible that management is prioritizing revenue growth over EPS growth at the moment.
You can see how earnings and revenue have changed over time in the image below (click on the chart to see the exact values).
T-Mobile US is well known by investors, and plenty of clever analysts have tried to predict the future profit levels. If you are thinking of buying or selling T-Mobile US stock, you should check this out free report showing analyst consensus estimates for future profits.
A Different Perspective
We’re pleased to report that T-Mobile US shareholders have received a total shareholder return of 1.0% over one year. However, the TSR over five years, coming in at 18% per year, is even more impressive. Potential buyers might understandably feel they’ve missed the opportunity, but it’s always possible business is still firing on all cylinders. While it is well worth considering the different impacts that market conditions can have on the share price, there are other factors that are even more important. Consider for instance, the ever-present specter of investment risk. We’ve identified 4 warning signs with T-Mobile US, and understanding them should be part of your investment process.
If you like to buy stocks alongside management, then you might just love this free list of companies. (Hint: insiders have been buying them).
Please note, the market returns quoted in this article reflect the market weighted average returns of stocks that currently trade on US exchanges.
Do you have feedback on this article? Concerned about the content? Get in touch with us directly. Alternatively, email editorial-team (at) simplywallst.com.
This article by Simply Wall St is general in nature. We provide commentary based on historical data and analyst forecasts only using an unbiased methodology and our articles are not intended to be financial advice. It does not constitute a recommendation to buy or sell any stock, and does not take into account your objectives, or your financial situation. We aim to bring you long-term focused analysis driven by fundamental data. Note that our analysis may not factor in the latest price-sensitive company announcements or qualitative material. Simply Wall St has no position in any stocks mentioned.