Sundry Photography
With strong fundamentals and a positive outlook for the future, Keysight Technologies, Inc. (NYSE:KEYS) may be an interesting stock for tech investors.
The company’s stock significantly outperformed the major indices during the difficult last year (roughly -3%) and has had an impressive run over the last five years, gaining nearly 300%. In this article, I will take the stance that the stock will continue this bullish performance of the past few years.
Target Markets And Industry Prospects
Keysight Technologies is a global industry leader in the manufacturing of electronic measurement instruments and design, simulation and test software. The company generates most of its revenue in the commercial communications end market. As in previous quarters, this market accounts for about half of the company’s sales. Besides this, the company operates in the electronic industrial solutions and aerospace, defense and government end markets.
According to Keysight itself, the company is the industry leader in all of these markets, with market shares of about a quarter. It also projects long-term annual growth averaging between 3% and 5%. However, there are doubts about rapid growth in the medium term: Goldman Sachs analyst Mark Delaney downgraded Keysight Technologies’ rating from Buy to Neutral on Tuesday (Jan. 10) because he expects growth in the communications infrastructure market, where the company has a large focus, to decline in 2023. Still, he sets his price target at $189, about 5% above Keysight’s current price, The Fly reports. Given that the company has consistently invested in R&D in recent years – nearly 16% of total revenue in fiscal year 2022 – demand for its products in a generally promising market seems assured.
The company’s regional focus is on the Asia-Pacific and the Americas. In Europe, the company generates only 20% of its revenues. Nevertheless, the company is a major player in the European market: Keysight recently announced that it is coordinating the European 6G test environment “6G-SANDBOX”. The project is a European Commission initiative to support the research and development as well as the validation of future communication technologies.
Thus, from a global perspective, the corporation has a firm foothold in a growing market and appears unwilling to let it slip, as it aspires to drive innovation. In doing so, it can draw on a strong financial foundation, as we will see below.
Stable Balance Sheet
Growth
Keysight has a very solid balance sheet, which it has continuously built up over the course of the last several years: Since 2015, the company has managed to consistently increase its total current assets from a previous $1.6 million to $4.2 million (FY 2022). Total assets have also increased over this period, reaching an all-time high of over USD 8 million in FY 2022. However, over the same period, the company has managed to keep liabilities fairly stable. Since 2015, total liabilities have risen from $2.2 million to just under $4 million, an increase of 78.5% over a full 7 years. The percentage increase in total assets, on the other hand, amounts to 130.8% during this time. I considered such long periods here, as growth has stagnated since around 2020 – albeit at a good level. For example, total assets grew by 4% in fiscal year 2022, while total liabilities declined slightly by around 1.5%.
Key Data in Comparison with Competitors
The recent lack of strong balance sheet growth does not leave the company in a worse position than its peers in key balance sheet-related indicators. Along with Keysight itself, I will look at the main competitors AMETEK (AME), Fortive (FTV), Teledyne Technologies (TDY), National Instruments (NATI) as well as Viavi Solutions (VIAV; ordered by market capitalization) in the following to enable a comparison of the key ratios.
Since I already wrote about the development of Keysight’s assets and liabilities, it makes sense to first look at the total-debt-to-total-assets ratio. This provides information about the financial leverage and thus the financial health of a company, as it puts all assets in relation to all liabilities. The following table lists this ratio and also the quick ratio:
Table 1: Comparison of Key Balance Sheet Data (Q4’22)
| Ratio | KEYS | AME | FTV | TDY | NUTS | VIAV |
| Total-Debt-to-Total-Assets Ratio | 0.49 | 0.41 | 0.41 | 0.44 | 0.50 | 0.63 |
| Quick Ratio | 2.09 | 0.82 | 0.62 | 1.10 | 1.24 | 2.38 |
Provided by the author based on data from SeekingAlpha
First, it is fairly easy to see that Keysight’s total-debt-to-total-assets ratio is slightly, but not significantly, higher than the ratios of the majority of its competitors. In this comparison, only Viavi Solutions stands out negatively, with a leverage of over 30% above the average of the figures presented here. With regard to Keysight, the quick ratio becomes more interesting. The quick ratio puts the assets of a company, which it can quickly turn into money, in relation to the current liabilities. It therefore makes a statement about the extent to which a company could pay all its current debts without selling inventory or taking on new debt. In this more short-term view, Keysight is well ahead of most of its competitors. Only Viavi Solutions exceeds Keysight’s quick ratio, which as a number in itself is very promising: Keysight would be able to pay all current debts, proving its good financial position.
Income Statement
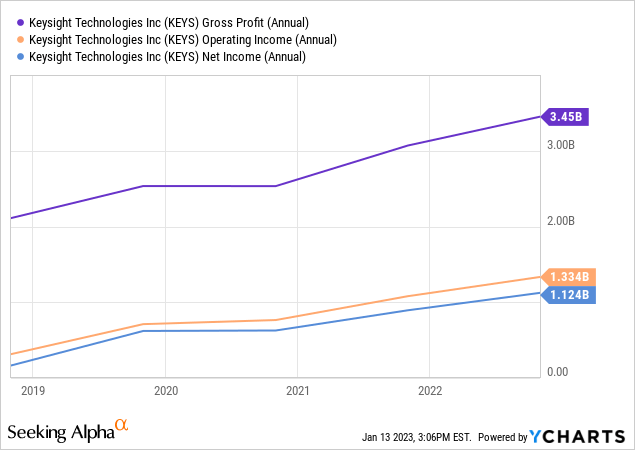
In addition to a rock-solid balance sheet, Keysight’s income statement is also highly attractive to investors. As the chart below shows, the company has managed to increase gross profit, profit from operations and net profit in recent years.

This shows quite clearly that the business model has been working well for years. The fact that Keysight – with roughly constant balance sheet volumes (see above) – is generating more sales and profits means that, in terms of assets and equity, it has significantly increased its profitability. It is not without reason that the company is now rated profitability grade A- by SeekingAlpha: The return on common equity (‘TTM’) of 28.3% is almost five times the sector median, and the return on total assets (‘TTM’) of just under 14% is even eight times higher. Both ratios are over 50% higher than the company’s five-year average.
In terms of sales, Keysight’s profitability is also in a good range. Let’s look again specifically at the competitors from above. Table 2 shows the gross profit margins and the net profit margins.
Table 2: Comparison of Key Income Statement Data (‘TTM’)
| Ratio | KEYS | AME | FTV | TDY | NUTS | VIAV |
| Gross Profit Margin | 63.65% | 34.91% | 57.63% | 40.68% | 68.98% | 62.12% |
| Net Profit Margin | 20.74% | 18.81% | 12.22% | 13.37% | 8.59% | 8.07% |
Provided by the author based on data from SeekingAlpha
It turns out that although the gross profit margin is not unusually good, Keysight retains the largest share of its revenue at the bottom line, which is the most important finding for potential investors. This figure is also remarkable given that the company puts nearly 16% of total revenue into R&D. AMETEK, which is similar in size to Keysight in terms of market capitalization, invested only about 5% of its revenue in R&D in 2021 and still retains less net profit. Keysight appears to be operating highly profitably today while also thinking about tomorrow.
Valuation
Keysight’s financial strength comes with a disadvantage: The valuation of the share is moderate, but rather high:
Table 3: Comparison of PE Ratios (Non-GAAP TTM)
| KEYS | AME | FTV | TDY | NUTS | VIAV | |
| PE Ratio | 23.32 | 26.32 |
21.92 |
23.38 | 21.14 | 12.23 |
Provided by the author based on data from SeekingAlpha
Compared to its direct peers, the company’s PE ratio is not particularly high (see Table 3), but the value of just over 20 is not favorable given the current economic situation. According to Schroders, the average trailing PE ratio of the S&P 500 during recessions typically reaches values of around 12. Should we get into a recession, Keysight’s PE ratio, which is very similar to that of the S&P 500, brings with it a downside risk that investors would have to bear. Is the stock worth this risk?
Conclusion
In my opinion, Keysight Technologies offers a fundamentally sound company: For years, the balance sheet has indicated consistently good financial health, while the data on the income statement has in fact improved recently. Keysight does not have an enormous lead over its competitors, but it always plays a good role in the comparisons presented and often finds itself in the top position. Despite the short-term uncertainty regarding the growth of the market in which the company operates as well as regarding the market risk, I consider Keysight to be a reasonable long-term investment for tech investors.