While Intel plans to pull in release dates of its 13th Generation Core ‘Raptor Lake’ processors for notebooks, and many of these CPUs are set to be released later this year, until today, no benchmark results of those chips have leaked. Yet as Intel’s partners begin to test new processors, some of their findings inevitably hit the Web.
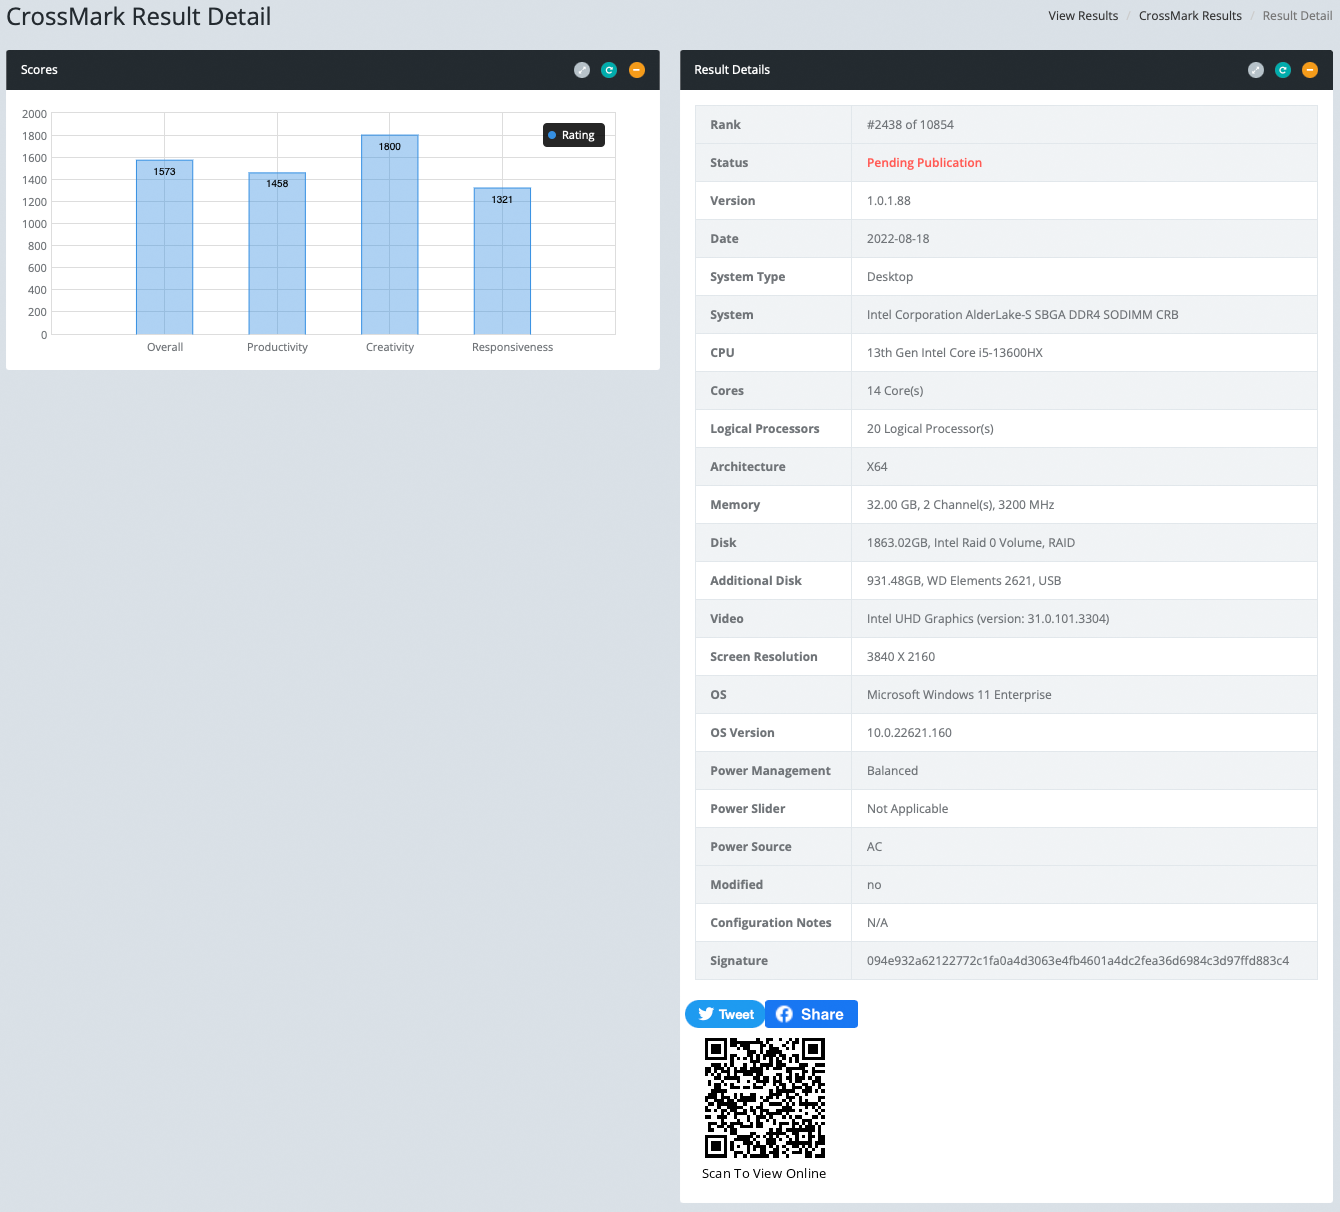
Today someone accidentally (or purportedly) published benchmark results of Intel’s Core i5-13600HX processor in BAPCo’s CrossMark benchmark (opens in new tab) (via @momomo_us (opens in new tab)). The CPU has 14 cores and can process 20 threads simultaneously, which means either a 6P + 8E configuration or a 4P and 10E cores configuration (we assume the latter). To add some context, Intel’s Core i5-12600HX processor has 12 cores (4P + 8E cores).
The CPU was tested using Intel’s AlderLake-S SBGA DDR4 SODIMM CRB (customer reference board) equipped with 32GB of DDR4-3200 memory and two 1TB SSDs running in RAID mode as well as plugged into a 4K display.
| overall | Productivity | Creativity | Responsiveness | Notes | |
|---|---|---|---|---|---|
| Core i5-13600HX | 1573 | 1458 | 1800 | 1321 | 14C/20T; 32GB DDR4-3200 RAM |
| Core i5-12600H | 1350 | 1268 | 1747 | 752 | 12C/16T; 16GB DDR5-4800 |
| Core i5-12600H | 1760 | 1622 | 2013 | 1506 | 12C/16T; 32GB DDR5-4800 |
It is necessary to note that Intel’s HX processors are aimed at desktop replacement laptops, and small form-factor desktops with good cooling as these CPUs feature base power of 55W and maximum turbo power of 157W. Since Intel’s HX CPUs are not particularly popular among users of the general-purpose CrossMark benchmark, we had to compare the results of Intel’s Core i5-13600HX (with a balanced power profile) with the Core i5-12600H. Meanwhile, the hitch is that all the latter results were obtained on a system equipped with a Full-HD monitor, so the comparison is not fair. Nevertheless, we took the best (which used the best performance power profile) and the worst (opens in new tab) results of the model i5-12600H to give some additional perspective.
Another thing to point out is that BAPCo’s CrossMark (opens in new tab) The benchmark has three groups of tests (opens in new tab) (consisting of seven sub-scenarios) — Productivity (document editing, spreadsheets, web browsing), Creativity (photo editing, photo organization, video editing), and Responsiveness (application launches and the file opens taken from other sub scenarios) — designed to illustrate general system performance and responsiveness ‘using models of real-world applications.’
All these scenarios are very general, so while they can quantify the difference between an entry-level Core i3-powered machine and a high-end Core i9-based system, we doubt that BAPCO’s CrossMark can accurately illustrate the difference between Intel’s Alder Lake and Raptor Lake.
