Every offseason, it feels like NHL fans have the same debate over a new player.
There’s always a player who plays on a terrible team, but everyone thinks they’re great, despite underwhelming results. This summer, the player is Jakob Chychrun, a 24-year-old defenseman for the Arizona Coyotes.
The consensus around Chychrun is that, while he hasn’t been great in Arizona, his performance will improve once he’s traded to a better team. But is it that simple?
Today, we will test that idea to see if a player’s results improve after he gets traded to a stronger team.
Raw Data
While people often assume players will improve when moving to a better team, this is a straight-forward hypothesis to test.
First, we have to find some metrics to measure NHL player output. For the sake of this article, we will use Evolving Hockey’s Goals Above Replacement (GAR). This catch-all metric estimates how valuable each player was in a given season. The larger the GAR, the more valuable the player.
With our GAR metric to measure how much a player was worth, now all we have to do is find players who changed teams and compare the change in their output when they swap teams.
To do this, I will use the change in standing points among players who changed teams in the offseason. To keep the analysis simple, I will only use players who played for a single team in the two seasons.
So, for example, take Johnny Gaudreau. He left the Calgary Flames this offseason in favor of the Columbus Blue Jackets. The Flames totaled 111 points last season, while the Jackets accrued 81. As a result, Gaudreau’s team quality going into next year has declined by 30 points.
Using that information, if improving team quality has helped players’ results, we should expect players like Gaudreau to see a decline in their performance the following season. Has that been the case?
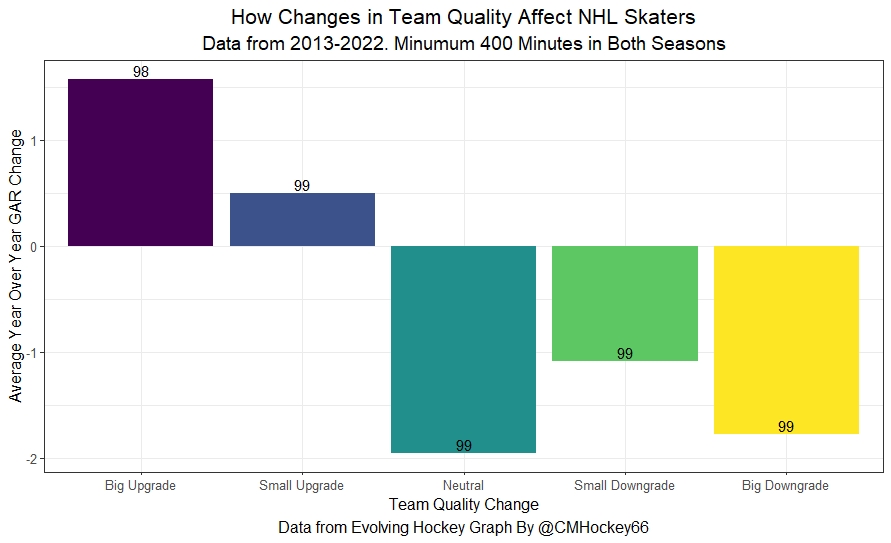
Overwhelmingly, yes. The trend is evident when we split the players into five separate bins based on how much their team improved.

On average, players with the most significant team improvement saw the largest jump in their respective GAR. The next biggest jump were players who saw slight improvements in their team quality.
Players who saw their team quality either stay the same or decline all had decreased GAR output, on average.
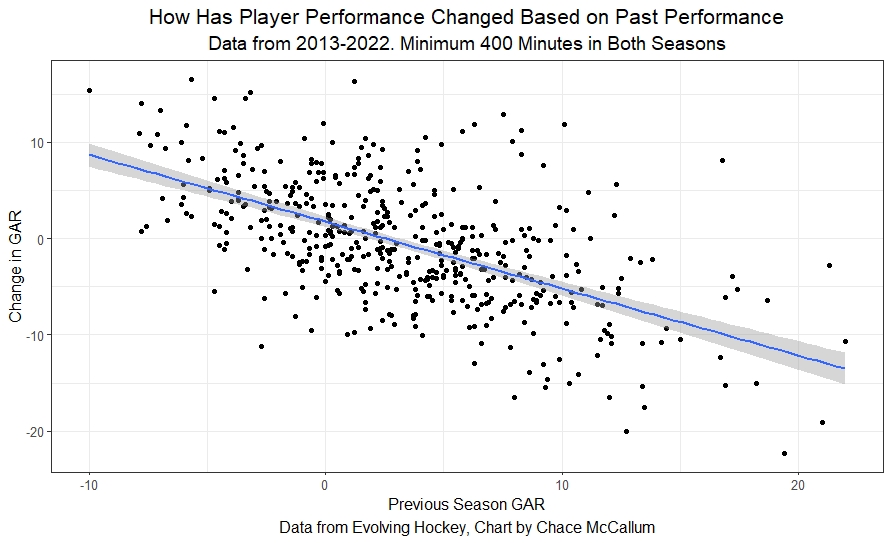
This is the scatter plot for those who prefer the continuous view of the same data.

Here we see the same linear trend. As players joined weaker teams, their GAR would decline by an increasingly large amount, on average.
Confounding Variables
The analysis above shows strong potential in the idea that increasing team quality is positively-related to skater results, but suffers from some potential problems.
The first possible issue is that year-over-year changes in GAR values are also a product of other things. For example, better players tend to get worse year over year.

And if the salary cap is doing its job pushing good players from solid teams to weak teams, that may be the reason we are finding the correlation above.
So we will need to account for how good the skaters were before changing teams, explicitly because better players tend to decline more.
Additionally, there is a possibility that what we saw in the first section was just increased opportunity. Intuitively, an equally-talented player should probably get more time on ice as the quality of the team around him declines because fewer teammates will be worth playing big minutes. So, we will also need to account for the time on ice the player played in each of the two seasons separately.
Putting it All Together
To account for so many variables simultaneously, we will use a regression model to test if changes in team quality are still related to changes in skater output.
Let’s run the model and see if team quality is still related to GAR changes.

The regression table above shows changes in team quality are still associated with increased performance even after accounting for the rest of the variables in the table.
We know this because the stars next to each coefficient denote statistical significance. As the statistical significance increases, we can be increasingly confident the relationship is real rather than noise, and we can be pretty confident the relationship between changes in team quality and future changes in GAR are not just luck.
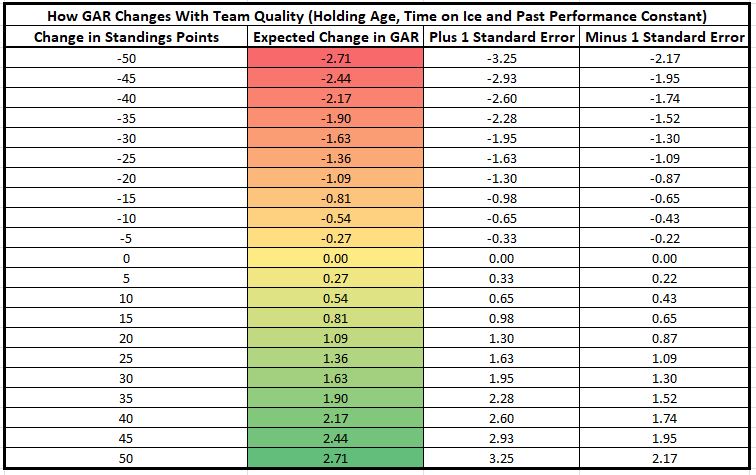
The 0.05 next to “team quality” shows us that holding the rest of the variables in the model constant, for each additional standing point a player’s new team has relative to their old team, we can expect their GAR to increase by 0.05.
In practice, we can now use this number with specific players.
Remember Johnny Gaudreau’s massive change? His team dropped 30 standings points. So, we multiply the 0.05 by the -30 standings-point differential and see that we can expect Gaudreau’s GAR to drop by 1.5 because of his drop in team quality.
Of course, the inverse is true for players who left for better teams.
For example, Paul Stastny is at an age where his GAR numbers are likely to decline quickly. However, after his new contract with the Carolina Hurricanes, he has something that may help mitigate the age-related decline.
Stastny left the 89-point Jets to join the 116-point Hurricanes. That 27-point increase in team quality is associated with an increase in GAR of 1.35, on average.
For more visual learners, here is a table that outlines the expected change in player results based on their change in team quality.

Adding Context
I realize it is highly unlikely that anyone has memorized the GAR distribution, so it might be difficult to contextualize what a drop in GAR of 1.5 means in practice.
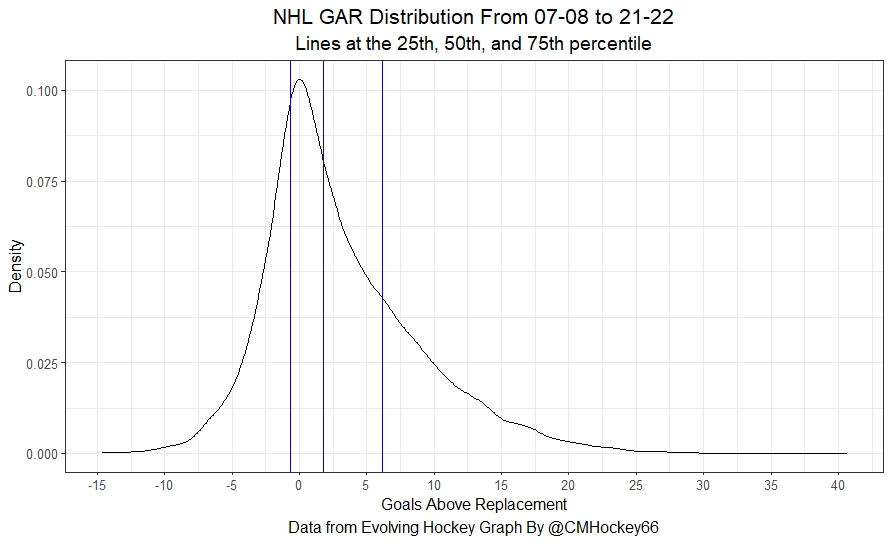
To help with that, let’s look at how GAR is distributed.

So remember our table from above? Well, here we can see GAR has a right-skewed distribution.
In hockey terms, Connor McDavid is more good than the worst players are bad. As a result, the changes in team quality are unlikely to mean much for the best players because they produce so much value already.
Where changes in GAR of 1 or 2 become meaningful is around the middle of the distribution.
The difference between a 25th percentile player and the median player has been about 2 GAR. Now, that change may be easily accounted for by a significant increase in team quality. So, while large increases in team quality won’t help turn a struggling player into a star, it may really help that mediocre free agent from a struggling team’s results.
Conclusion
So can fans expect better players’ results when he leaves a lottery team for a Stanley Cup contender? Yes, an increase in team quality is positively associated with player output.
This holds even after accounting for the player’s previous output, age, opportunity, and future time on ice. However, it is worth noting these changes are not massive. So, the change is only meaningful when there is a significant increase or decrease in team quality.
Even from our extreme example, a skater’s GAR changing by 1.5. is only a meaningful amount for the lower-level to average range skaters. So, is a league-average team going to completely transform a skater from a weaker team? Probably not.
But, if a player significantly increases their team quality, we should still see an uptick in their on-ice results.