When you buy shares in a company, it’s worth keeping in mind the possibility that it could fail, and you could lose your money. But on the bright side, if you buy shares in a high quality company at the right price, you can gain well over 100%. For instance, the price of Acushnet Holdings Corp. (NYSE:GOLF) stock is up an impressive 112% over the last five years. Better yet, the share price has risen 3.0% in the last week. But this could be related to the buoyant market which is up about 4.5% in a week.
The past week has proven to be lucrative for Acushnet Holdings investors, so let’s see if fundamentals drove the company’s five-year performance.
View our latest analysis for Acushnet Holdings
In his essay The Superinvestors of Graham-and-Doddsville Warren Buffett described how share prices do not always rationally reflect the value of a business. One imperfect but simple way to consider how the market perception of a company has shifted is to compare the change in the earnings per share (EPS) with the share price movement.
During five years of share price growth, Acushnet Holdings achieved compound earnings per share (EPS) growth of 16% per year. That makes the EPS growth particularly close to the annual share price growth of 16%. This indicates that investor sentiment towards the company has not changed a great deal. Indeed, it would appear that the share price is reacting to the EPS.
You can see how EPS has changed over time in the image below (click on the chart to see the exact values).
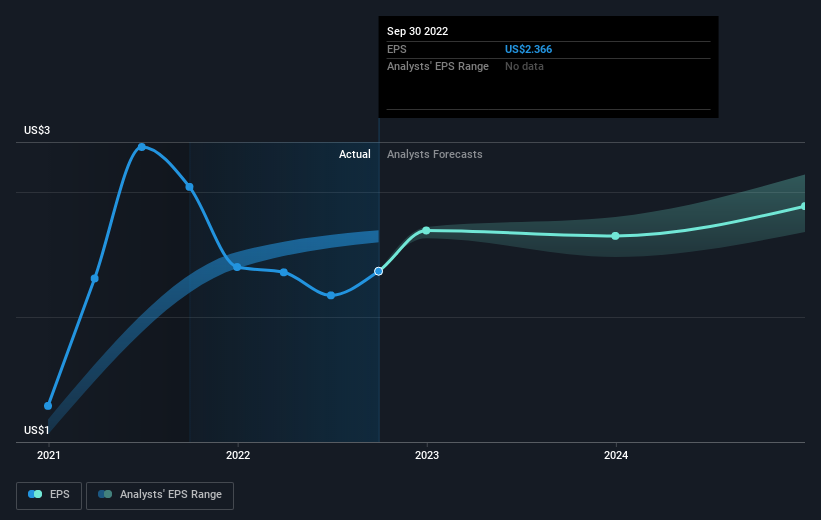
Dive deeper into Acushnet Holdings’ key metrics by checking this interactive graph of Acushnet Holdings’ earnings, revenue and cash flow.
What About Dividends?
It is important to consider the total shareholder return, as well as the share price return, for any given stock. The TSR is a return calculation that accounts for the value of cash dividends (assuming that any dividend received was reinvested) and the calculated value of any discounted capital raisings and spin-offs. It’s fair to say that the TSR gives a more complete picture for stocks that pay a dividend. We note that for Acushnet Holdings the TSR over the last 5 years was 133%, which is better than the share price return mentioned above. And there’s no prize for guessing that the dividend payments largely explain the divergence!
A Different Perspective
Although it hurts that Acushnet Holdings returned a loss of 11% in the last twelve months, the broader market was actually worse, returning a loss of 16%. Longer term investors wouldn’t be so upset, since they would have made 18%, each year, over five years. In the best case scenario, the last year is just a temporary blip on the journey to a brighter future. It’s always interesting to track share price performance over the longer term. But to understand Acushnet Holdings better, we need to consider many other factors. Even so, be aware that Acushnet Holdings is showing 2 warning signs in our investment analysis you should know about…
But note: Acushnet Holdings may not be the best stock to buy. So take a peek at this free list of interesting companies with past earnings growth (and further growth forecast).
Please note, the market returns quoted in this article reflect the market weighted average returns of stocks that currently trade on US exchanges.
What are the risks and opportunities for Acushnet Holdings?
Acushnet Holdings Corp. designs, develops, manufactures, and distributes golf products in the United States, Europe, the Middle East, Africa, Japan, Korea, and internationally.
View Full Analysis
Rewards
-
Trading at 6.9% below our estimate of its fair value
Risks
-
Significant insider selling over the past 3 months
View all Risks and Rewards
Have feedback on this article? Concerned about the content? Get in touch with us directly. Alternatively, email editorial-team (at) simplywallst.com.
This article by Simply Wall St is general in nature. We provide commentary based on historical data and analyst forecasts only using an unbiased methodology and our articles are not intended to be financial advice. It does not constitute a recommendation to buy or sell any stock, and does not take into account your objectives, or your financial situation. We aim to bring you long-term focused analysis driven by fundamental data. Note that our analysis may not factor in the latest price-sensitive company announcements or qualitative material. Simply Wall St has no position in any stocks mentioned.