We are launching a new FanGraphs mobile app, which is available for both iOS and Android devices. You may remember our previous attempt at an iOS app over a decade ago, but this is a completely new app that more closely reflects our website, built with a native mobile experience specifically for phones in mind.


The app is free to download, but similar to our website, it has ads unless you are signed in as a FanGraphs Member. Any customization features in the app will also only be available to Members.
As we launch today, the app has player pages, scores, and standings available. We plan on adding more features from the site in the future.
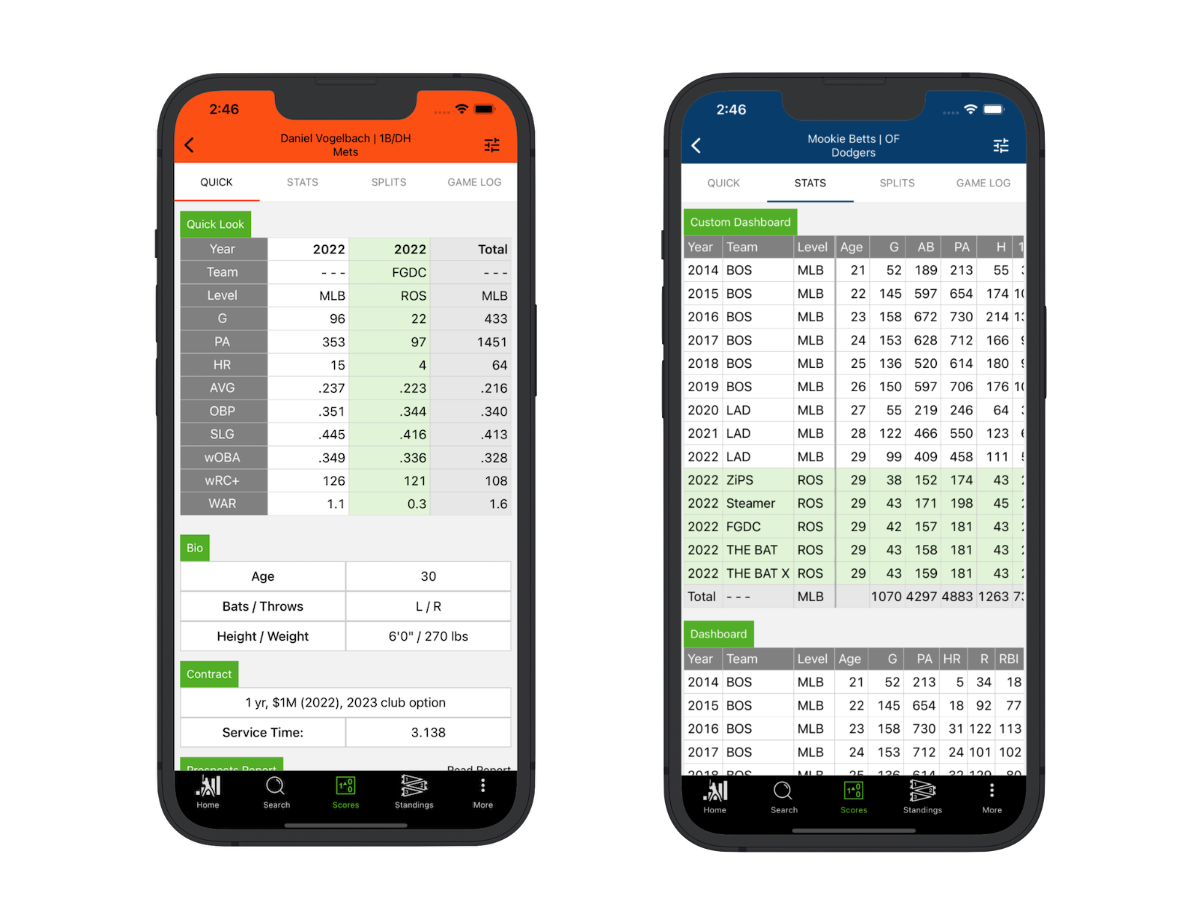
The search page is probably the easiest way to find a player you are looking for. Within the app’s player pages, we have a quick look screen, season stats, splits, and game logs:
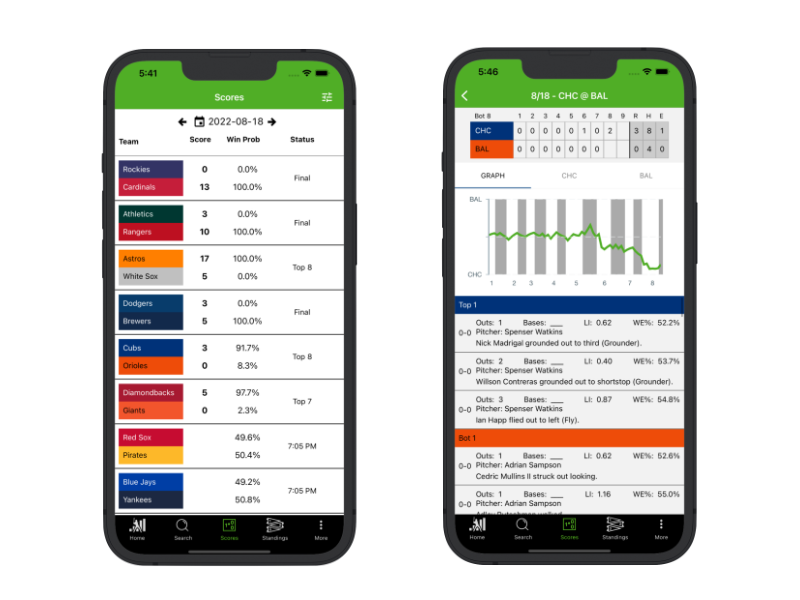
The scores screen has that day’s scores, along with the win probability of each game’s teams. You’ll also find the lineups for games that haven’t started yet along with each game’s win probability graph, play log, box score, and line score:
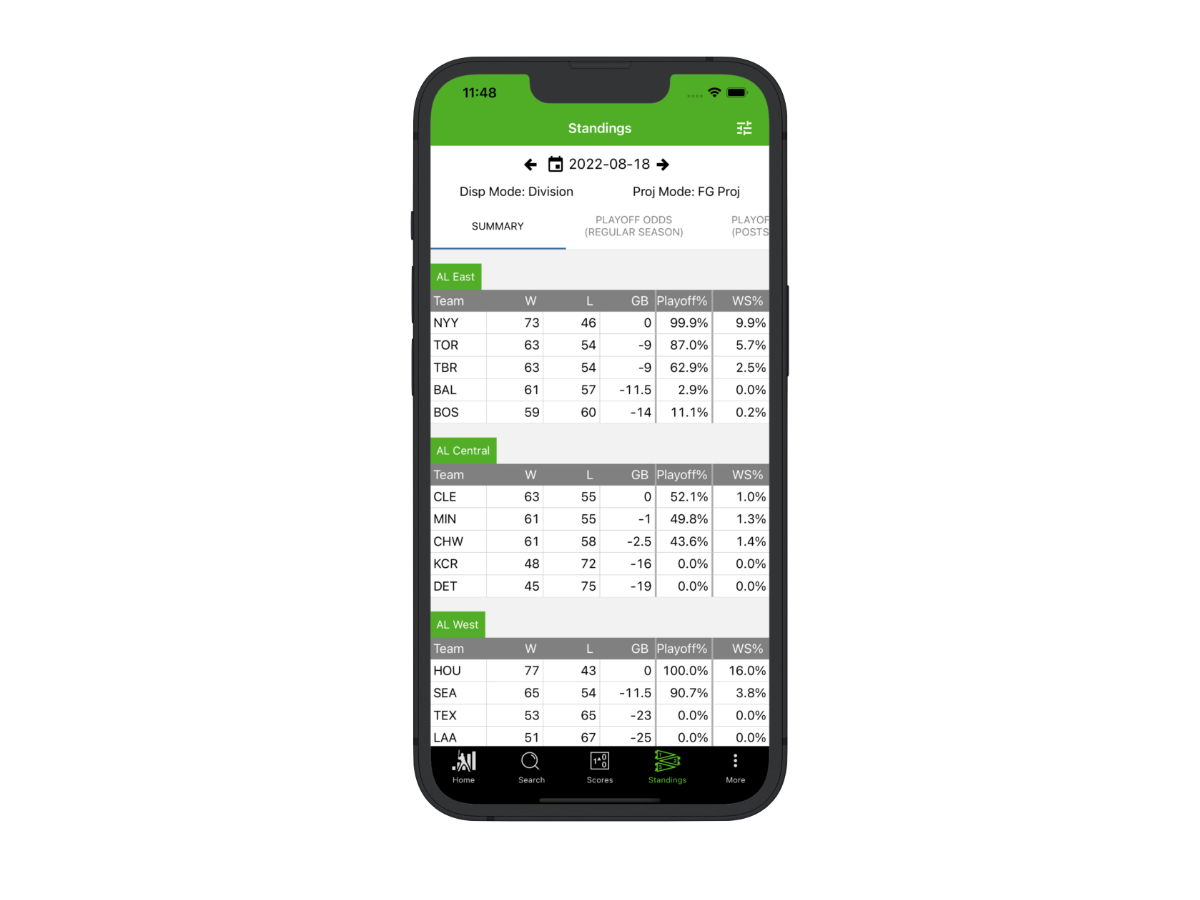
The standings screen has current division, league, and MLB standings, as well as our playoff odds:
I wanted to review a few settings you can change within the app.
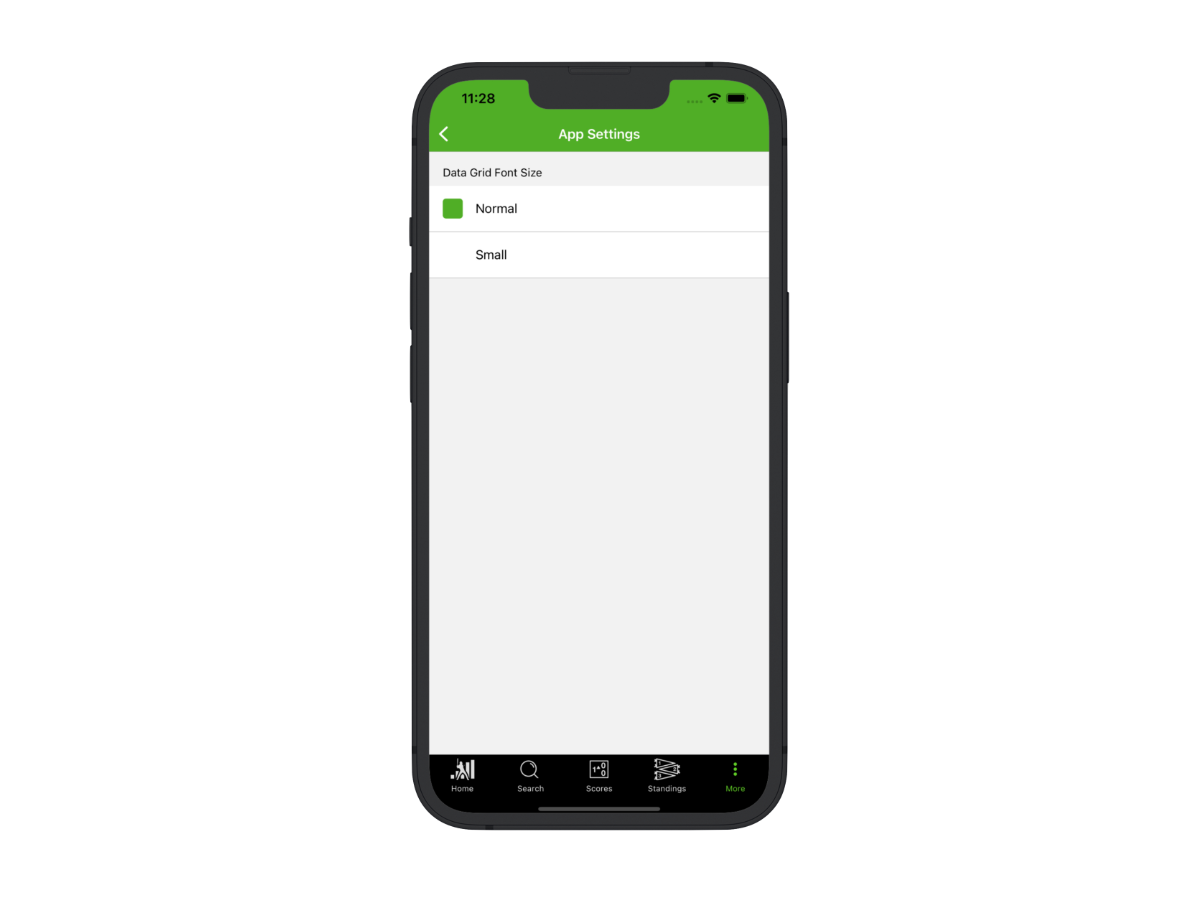
The app supports your mobile device’s text size accessibility options. Additionally, you can choose to make the font size on the data grid smaller to give you more columns of data on a given screen. This can be found in More >> App Settings:
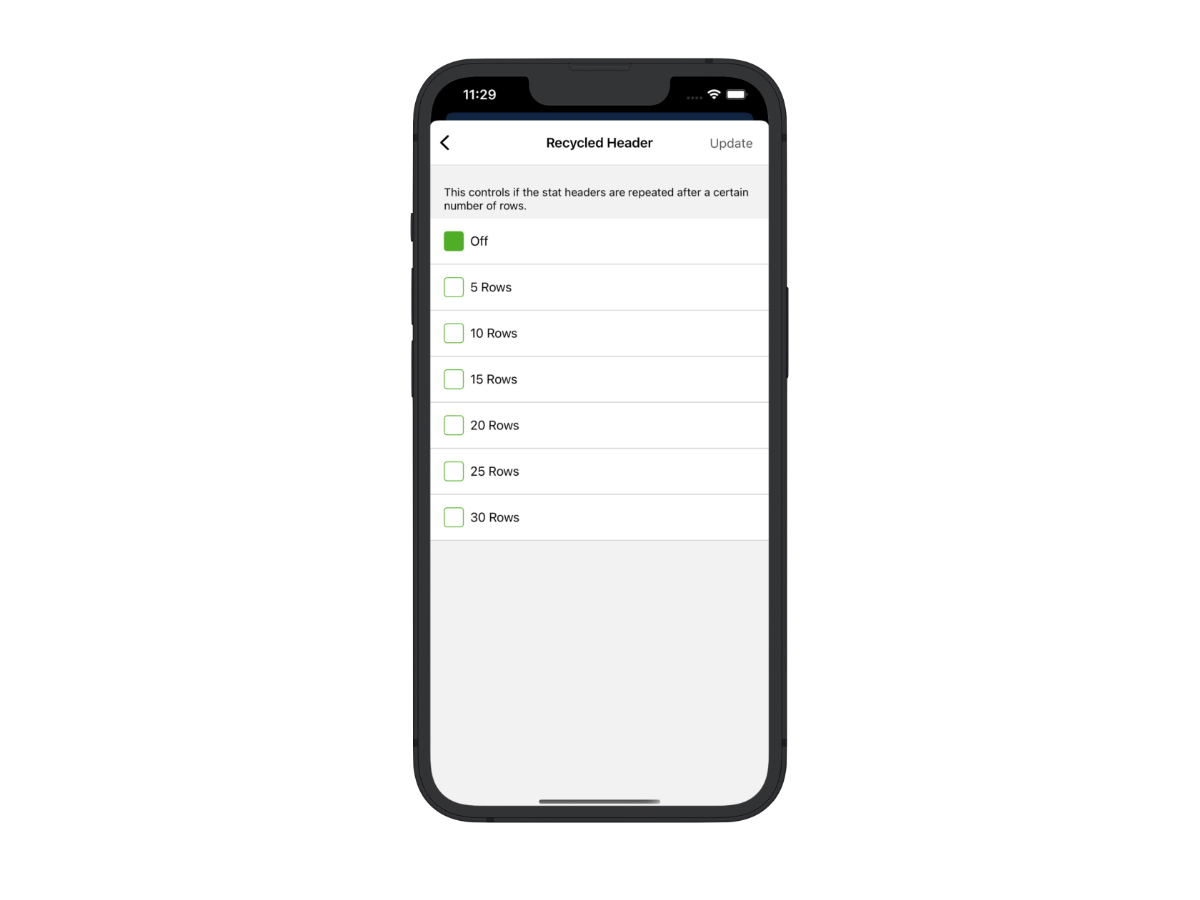
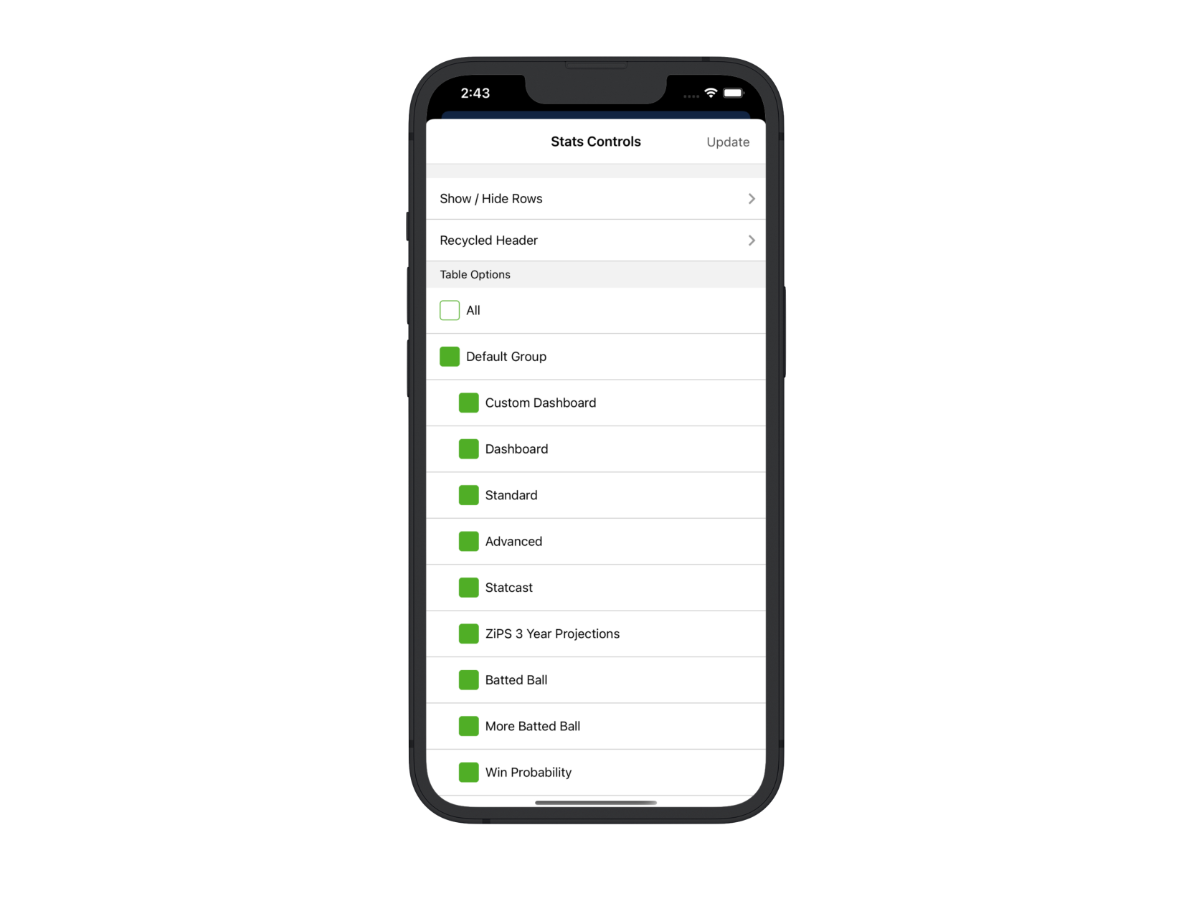
We created a recycled header option for the season stats and game logs. This puts the stat header every X number of rows, so you don’t have to scroll to the top to read which stat you are looking for. This can be found in the controls for either the season stats or the game logs:
For Members, we’ve also included custom dashboards for player pages, which are set on the site:
While we were developing the app, we spent a lot of time thinking about how the mobile and desktop uses for FanGraphs might be different. Phones aren’t as conducive to heavy research as a web-based desktop experience, but there are plenty of times when you aren’t near your computer and want to use the site. We are trying to create the best experience for that, whether it’s discussing the postseason picture while out with friends, or checking in on how a particular player’s season is going while you’re at the ballpark.
As we continue to build the app, we’ll look to usage data and user feedback to determine what features to add next. Among the features we are considering for the app’s next iteration are articles, leaderboards, prospect information and RosterResource features. We are also considering adding push notifications, but we want to know if our Members want them and what use cases they might want them for. Please let us know what would be most useful to you when you are using FanGraphs on the app.
I wanted to give credit and say thanks to several people. Luke Hooper designed the splash screen, graphics, and icons for the app. He took the ideas we had and brought them to another level. David Appelman created FanGraphs and has developed the site for over 17 years. Much of the app was built upon the data loaders and data APIs that he has created and maintained. Meg Rowley helped with all of the focus groups and with the concept and decision-making throughout the app’s development. Her feedback and influence on all aspects of the site and the app is ubiquitous and appreciated. Finally, extra thanks to all of FanGraphs’ staff and industry contacts, as well as the substantial number of my friends, who served as beta testers or participated in a focus group.
We hope you enjoy, and thank you for supporting FanGraphs!