This section summarizes the results provided by the proposed playing field segmentation strategy. First, “Analysis of the results obtained” section analyzes the quality of the results obtained, as well as the influence on this quality of each of the stages that make up the strategy. Then, “Parameter analysis” section discusses parameter selection for optimal results. “Limitations” section discusses the limitations of the strategy. Finally, “Comparison with other strategies” section compares our results with those obtained using other segmentation strategies.
To analyze the quality of our strategy, images from the following two public databases have been used, which, to our knowledge, are the only ones that provide ground truth files that include binary masks indicating what areas of the images correspond to the playing field:
-
LaSoDa: The Labeled Soccer Database (LaSoDa) consists of 60 annotated Full HD images ((1920times 1080) pixels) corresponding to five matches played in stadiums with different characteristics (different camera positions and different shades of grass). These images show different zoom levels (from images that show only the goal area to images that show more than half of the pitch) and have been acquired with four different types of cameras (master camera, side camera, end camera, and aerial camera) . Additionally, it includes challenging lighting conditions (day and night matches and strong contrast between sunlit and shaded areas). This dataset is available at https://www.gti.ssr.upm.es/data/lasoda.
-
Homayounfar’s database: The database proposed in51 is composed by 395 HD images ((1280times 720) pixels) from twenty matches in stadiums with different grass textures and lighting conditions. Unlike LaSoDa, all of its images have been acquired with the master camera (the one used most of the time in soccer broadcasting, placed approximately on the extension of the halfway line) and show similar zoom levels. However, they are more varied than the LaSoDa images in terms of shades of grass and presence of shadows.
Quality has been measured at the pixel level by the recall ((textrm{rec})), precision ((textrm{pre})), and F-score ((f)) as follows:
$$begin{aligned} textrm{rec}=frac{textrm{tp}}{textrm{tp}+textrm{fn}},;textrm{pre}=frac{textrm{ tp}}{textrm{tp}+textrm{fp}},;f=frac{2textrm{tp}}{2textrm{tp}+textrm{fp}+textrm{fn} }, end{aligned}$$
(6)
where (textrm{tp}), (textrm{fn})and (textrm{fp}) are, respectively, the amounts of true positives, false negatives and false positives. Note that the F-score is also known as F1-score or Dice Similarity Coefficient (DSC).
Regarding the computational cost of the strategy, the most costly step, by far, is the well-known EM algorithm that is used to approximate the pdf of (g). However, the literature reports that it is feasible to run EM on a problem of our scale (histograms made of just a few hundred data points) within very few milliseconds52. Consequently, we consider it feasible to make our system work in real time on video sequences.
Analysis of the results obtained
Table 1 summarizes the results obtained for each of the 25 matches in which the 455 analyzed test images are distributed (the images corresponding to all these results are available at https://www.gti.ssr.upm.es/data/playing- field-segmentation). These results correspond to the following cases:
-
Case 1: Results from the mask (hat{M}_{textrm{PF}}) (after performing the green chromaticity analysis).
-
Case 2: Results from the mask (tilde{M}_{textrm{PF}}) (after performing the chromatic distortion analysis).
-
Case 3: Results from the mask (M_{textrm{PF}}) (final results).
In addition, Fig. 7 shows some representative results obtained in images with different lighting conditions, shades of grass, zoom levels and colors on billboards and stands.

Some representative results obtained with the proposed strategy. Original images from46 and53.
The high recall values obtained after applying the green chromaticity analysis (Case 1) shows that this first stage of analysis correctly identifies the vast majority of the pixels that make up the playing field. However, false detections due to the presence of cyan or yellow regions have resulted in significantly lower precision values, especially in the case of the images of some matches (eg, Match 3) in Homayounfar’s database in which the predominant color in the stands is yellow or cyan.
Most of these false detections disappear after applying the chromatic distortion analysis (Case 2), which results in a significant increase in precision.
The final results (Case 3) show that, after applying the analysis at the regional level, an improvement in both recall and precision is achieved. This is because the gaps due to the presence of players on the playing field have been filled in and, in addition, the false detections caused by small regions in the stands with colors similar to those of the grass have been eliminated.
Parameter analysis
We had previously stated that the strategy depends on three parameters that must be configured manually (one in the pre-processing stage and two in the pixel-level analysis stage). In this subsection, the influence of these parameters on the quality of the results is analyzed.
The results in Table 1 have been obtained with the combination of parameters that have resulted in the highest overall F-score. These parameters are summarized in Table 2, whereas the graphs in Fig. 8 report the variations in quality of the results when any one of them is modified. The following conclusions can be obtained from these graphs:
-
Proportionality factor that determines the diameter of the structuring element used in the pre-processing, (alpha _{e}): Although the best results are obtained with (alpha _{e}=0.5), for higher values of this parameter the quality is only very slightly reduced. On the other hand, if (alpha _{e}) is too low (eg, (alpha _{e}=0.25)) or the pre-processing is not applied (ie, (alpha _{e}=0)), the quality reduction is very noticeable, since the white lines are not well integrated into the grass.
-
Maximum number of Gaussian distributions in the estimation of the pdf of the green chromaticity, (N_{textrm{G}}): For values above 2 the quality is very similar, being slightly better in the case of (N_{textrm{G}}=6).
-
Maximum allowed chromatic distortion, (T_{textrm{c}}): The quality of the results is very high with values of (T_{textrm{c}}) in a relatively wide band ((T_{textrm{c}}in left[ 0.15, 0.4right])). Outside this range the quality is noticeably reduced.

Quality of the results based on the values of the parameters on which the proposed strategy depends.
This analysis shows that none of the parameters is especially critical for the strategy, since all of them have significantly wide ranges of values in which the quality of the results is very similar.
Limitations
It should be noted that the proposed segmentation strategy is based on the assumption that the playing field is the largest green element in the image.
Consequently, it can fail in scenarios where the playing field is surrounded by large regions that are also green.
Although these situations are not common in professional stadiums (there is usually a wide variety of colors in the stands due to the amount of spectators that occupies them), they can occur in stadiums with green stands and with little or no fans, or in non -professional playing fields that, instead of being surrounded by stands, are surrounded by vegetation.
An example of this limitation is illustrated in Fig. 9, where the top row of images shows the results obtained in a stadium with empty green stands and the bottom row of images shows the results in the same stadium but with a large number of spectators in the stands.

Results obtained in a stadium with green stands: without an audience (top row of images) and with some audience (bottom row of images). Original images from54 and55.
Comparison with other strategies
The proposed strategy has been compared to four playing field segmentation methods that are representative of the three types of strategies described in “Related work” section:
-
M1: RGB-based method used in37,38,39which is based on the rule (G>R>B).
-
M2: RGB-based method recently proposed in40which uses the rules (G>R) and (G>R).
-
M3: Hue-based method used in the strategies32,33,34,35,36which is based on separating the dominant mode from the rest of the data in the histogram of the hue component.
-
M4: g-based method used in31,44which is based on the analysis of the pdf of the green chromaticity.
The comparisons have been made both in the case of not applying any post-processing at the regional level (called Case 2 in “Analysis of the results obtained” section) and applying post-processing (Case 3). As stated in the “Related work” section, the strategies in which these methods are used apply different region-based post-processing stages. To make a fair comparison between methods and given that the post-processing in the proposed strategy is the only one that does not depend on pre-established thresholds, our post-processing has been applied to all methods in the evaluation of the Case 3.
Since the area of the playing field visible in any image is always a single convex region, many of the strategies we compare against apply a convex hull as the last stage of their region-level post-processing. For this reason, we have decided to include in the comparisons a fourth case (Case 4) in which convex hulling is applied as the last stage of the post-processing.
The graphs in Fig. 10 compare the global quality obtained with our strategy and with the 4 previously described methods in the three cases mentioned. In these graphs, in addition to the values of (textrm{rec}), (textrm{pre})and (f)the range of values of each of these variables has also been included, as well as the standard deviation of the values of (f) ((f_{textrm{std}})).

Summary of the quality obtained with our strategy and 4 other segmentation methods. The error bars report the best and worst results for each metric across the entire dataset, showing the robustness of our proposal.
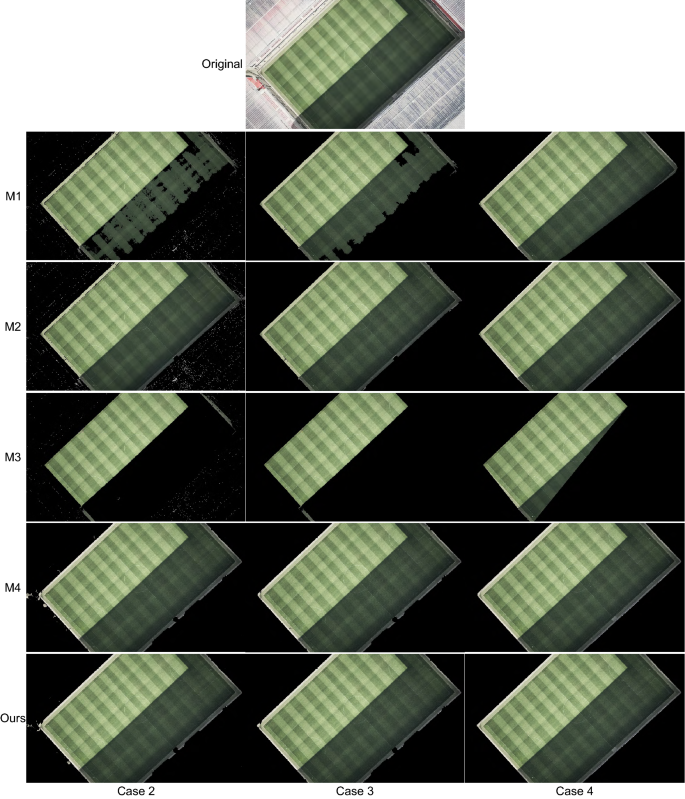
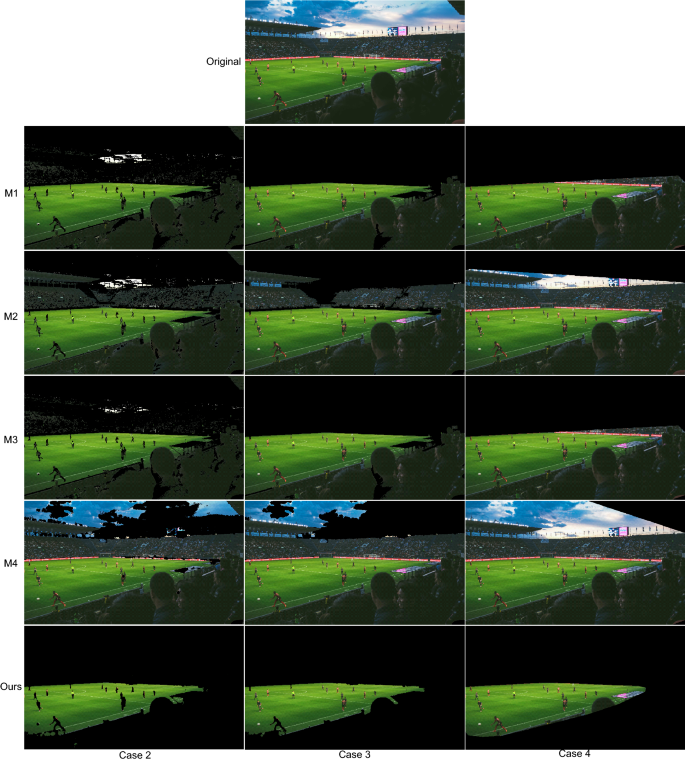
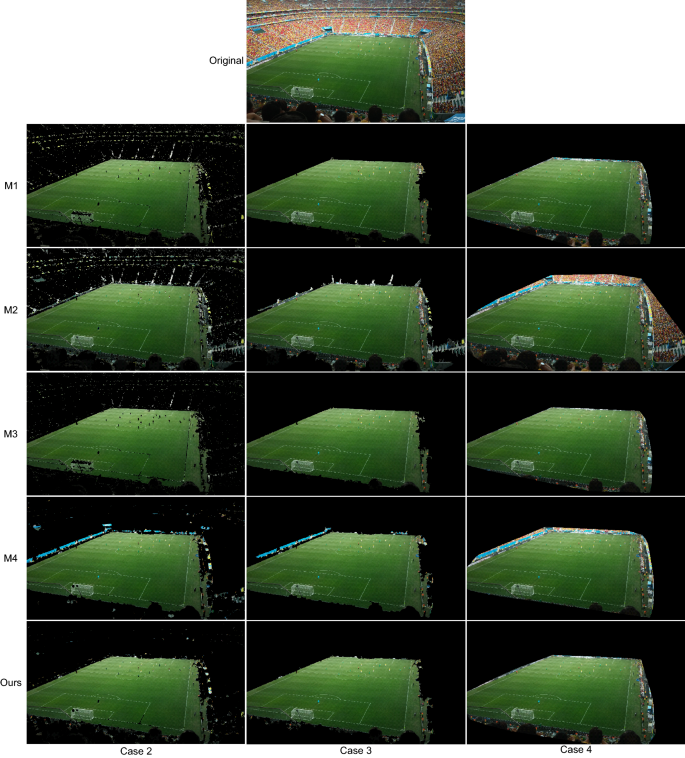
The results before applying the post-processing (Case 2) show that our strategy is the one that obtains the best results overall. The methods M1 and M3 result in many false negatives in images with areas of the playing field with strong shadows (see Fig. 11). In images where the stands include areas with poor color information (ie the red, green, and blue channels are very similar) the methods M1 and M2 result in several false positives (see Fig. 12). Regarding, the method M4, it fails in images with areas with colors that cannot be correctly filtered in the green chromaticity color space (eg, the sky in Fig. 12 or the billboards in Fig. 13).

Results obtained in an image with strong shadows. Original image from46.

Results obtained in an image with poor color information in the stands. Original image from46.

Results obtained in an image with cyan billboards. Original image from46.
The graphs in Fig. 10 also show that after including post-processing (Case 3) the quality of the results of the five compared strategies is improved (with our strategy still obtaining the best results).
Regarding the Case 4, as expected, by including the convex hulling in the post-processing the recall of all methods is improved. However, this improvement does not compensate for the worsening of the precision values (ie, the F-score values get worse). The method least affected by this quality reduction is the one proposed.
Finally, we must take into account that our strategy is not only the one that provides the best overall results (the highest F-score), but it is also the one that provides the lowest value of (f_{textrm{std}})which shows that our results are the most consistent.