In Week 6 of TWC’s GSAx charts, one goalie completely stumbled out of the blocks to have a truly awful performance. It literally forced the axes to change on the plots just to accommodate for how bad it was. Who was it? And what other storylines stemmed from the crease this week? Let’s find out.
Goals saved above expected as of November 22, 2022
If you’ve seen these plots before, please feel free to scroll right down and start checking out the visualizations. Otherwise, here’s a quick explainer on how to read the GSAx charts.
One way to objectively compare goaltenders is to evaluate their goals saved above expected (GSAx). For every shot, there’s an assigned expected goal (xG) value, and as a goaltender makes or doesn’t make saves based on expected values, the difference between their xG against and their actual goals against will start varying compared to other goaltenders.
With the randomness of goaltending seemingly happening not just season over season but at times even week over week, we can plot every goaltender’s GSAx to see how they stack up compared to the rest of the league. Using data visualization, comparing goaltenders can be done quickly with a lot of context in each chart.
For the first week, GSAx plots were presented from October 7 through October 18—the data being combined into a longer week. From here on out, each set of charts will be weekly from Wednesday’s games through to the following Tuesday’s games. This is to capture the additional slate of games typically played on Tuesdays, for no other reason than to have the most data available in a timely, yet weekly manner.
In addition to weekly GSAx plots, season-to-date charts will also be looked at to see how goalies stack up against each other over the course of a season. This will help highlight which goaltenders are among the best and who should be frontrunners for the Vezina Trophy. All data is from NaturalStatTrick.com.
Weekly goals saved above expected plots
The plots are split into each division, and then the teams are ranked in order from the highest total team GSAx to the lowest. Each goaltender will then sit along the x-axis based on their GSAx totals. The color of each goaltender is determined based on total shots against compared to the whole league (as opposed to per division)—the more shots a goaltender faces, the brighter and yellower their point; the fewer shots, the darker and bluer.
Similarly to the shots against color being league-wide, the x-axis per plot is also scaled league-wide, based on the two individual goaltenders with the highest and lowest GSAx. This makes visual comparisons between the four plots a bit easier.
Pacific Division goaltenders

Finally, for the first time this season, Thatcher Demko finds himself with a positive GSAx. Not only did he have a positive week, he led the Pacific Division.
Now looking at the chart, it looks like the Pacific was tightly bound together—and that is true—but it also signals that elsewhere in the NHL at least one goaltender had a GSAx of lower than -5.0. We’ll see where that goalie is soon enough.
As for the Pacific, as the trend has been all season, most goalies in this division are below breakeven. And even good performances, like Demko and Martin Jones, are very pedestrian in other divisions. A bit of a silver lining is that Cal Petersen’s division-worst week wasn’t that bad all things considered. As mentioned, it was a tight week.
Weak week after weak week, the Pacific goalies weep and weep.
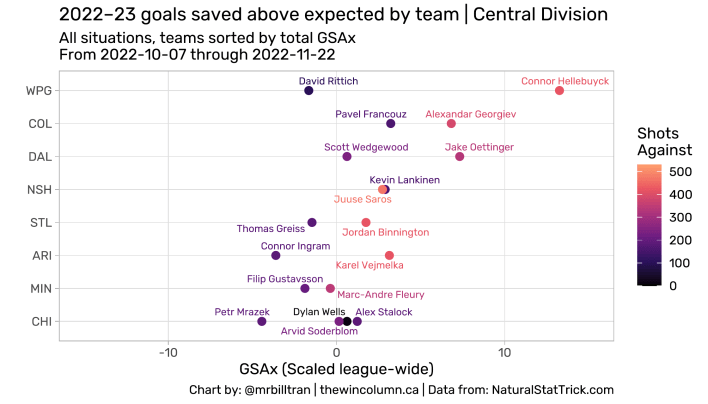
Central Division goaltenders

Immediately in the Central, there’s a more pronounced spread of good versus bad weeks among the goalies. Several goalies had good weeks, led by Pavel Francouz. His counterpart Alexandar Georgiev—who played in one game—posted a GSAx of 2.13, higher than every Pacific Division goalie.
This is a lot of harking on one division, but it’s a clear trend that the Pacific is just not having a great season in the crease overall.
Now back to the Central, some names that are interesting include Connor Ingram, who finally had a good game and ended with a positive GSAx. It’s rare for Connor Hellebuyck not to be atop the division—especially when he posts positive GSAx—but four other goaltenders posted better.
Arvid Soderblom was on his own as the worst goalie in the Central this week, but the second worst was his goalie partner in Petr Mrazek. Not a great week for Chicago.
Metropolitan Division goaltenders

The reigning Vezina Trophy winner found himself leading the Metropolitan as Igor Shesterkin had the strongest individual performance of the week with a heavy workload to boot.
However, New Jersey’s tandem of Vitek Vanecek and Akira Schmid had a higher cumulative GSAx as they extended their win streak to 13 games over the week.
Carter Hart had a bit of a bad week, ending up with a negative GSAx. He’s been one of the league’s busiest goaltenders and is arguably the only reason the Flyers haven’t fully imploded. A bad week for him right now is an anomaly so we’ll keep an eye to see if it’s an outlier or a bad trend.
Joonas Korpisalo was the Metro’s worst goalie this week. Usually for Columbus, it’d be Elvis Merzlikins struggling, but with him being out with an injury, Korpisalo seamlessly took his spot (much to the Blue Jackets’ dissatisfaction).
Atlantic Division goaltenders

Ah, there he is. The goalie that broke the chart axes this week was Sergei Bobrovsky. In 34 shots faced, he gave up nine goals. Every other goalie in the league being bound between -5.0 to 5.0 GSAx makes Bobrovsky’s stumble look even worse. It was a week to forget for him.
Elsewhere in the division, Anton Forsberg had a strong week in net. A big number of goalies ended up very close to zero GSAx, as Jeremy Swayman, Andrei Vasilevskiy, Ville Husso, and Eric Comrie were all straddling the zero GSAx line.
It’s interesting to see that this occurred despite all of these goalies facing very different shot totals. Vasilevskiy saw the most shots in the league with 101, while Swayman only faced 18.
Season-to-date goals saved above expected plots
Now turning to season-to-date plots, let’s check out how the season stacks up. The color palette for the season-to-date charts is also changed to differentiate them from the weeklies.
The plots are rescaled to account for different maximum and minimum GSAx values, but as above, all four divisions are scaled together to make the season-to-date comparisons easier. The scale for the season goes from -15 to 15 GSAx, the same as last week. For goalies to go even higher or lower, it’ll start getting harder and harder as it requires elite goaltending for weeks on end to rise up, or a complete disaster to crater down.
Pacific Division goaltenders

The Pacific Division has an interesting storyline here. Both Logan Thompson and Stuart Skinner dropped lower closer to their peers. What was once a two-horse race between the two of them now sees Jones taking over in Thompson’s place.
Despite having the lowest GSAx as a team in the division, the Los Angeles Kings are still hanging onto second place, although other teams have games in hand.
What’s interesting about the Pacific overall is how the plot shapes up. Both at the top and the bottom, the best goalie isn’t on the best team, and the worst goalie similarly isn’t on the worst team. We can see that Jones and Skinner and anchored by Philipp Grubauer and Jack Campbell. We can also see that Demko is buoyed by Spencer Martin.
Central Division goaltenders
Hellebuyck is in his own league as the Central’s best goaltender with no one else close. Over the first six weeks of the season, his consistency is what has elevated him far ahead of his peers.
The Colorado Avalanche are getting good performances from both their goalies, and part of this is due to their elite defense corps. But the goalies are holding up their end of the bargain too.
It’s also interesting to contrast the Central to the Pacific. Even with Mrazek being the worst goalie in the Central in GSAx with -4.44, six other Pacific goalies have a worse GSAx. Overall, the Central is doing well with a majority of goalies with positive GSAx values, and the ones with negative GSAx aren’t that negative, all things considered.
Metropolitan Division goaltenders

Ilya Sorokin and Hart both had negative GSAx weeks, but they’re still neck and neck as the Metropolitan’s best. While they’re still behind Hellebuyck, this trio has all been incredible in the first quarter of the season.
The gap between Sorokin and Hart versus the rest of the Metro is pretty large. Shesterkin takes third place while having just 5.09 GSAx—both Sorokin and Hart more than double that.
Aside from the outliers (on both ends with Merzlikins being the league anchor for worst GSAx), the Metro has a healthy mix of good and bad goalies in terms of GSAx. Ironically, if you don’t look at the outliers, no one really stands out, for better or for worse.
The Metro is definitely a division of extremes with varying performances across the board.
Atlantic Division goaltenders

The Atlantic also had a big spread in GSAx from top to bottom. At the top, Linus Ullmark is pulling away and could be vying to put himself into Vezina conversations. He hasn’t broken the 10.0 GSAx threshold like the other three goalies mentioned above, but he is standing out in the division when no other goalie has.
GSAx is volatile in the sense that a single good or bad stretch of games could really change a goalie’s rank. This was seen most drastically in Bobrovsky, whose bad week not only hurt him, but also dragged the Panthers down the rankings too. For reference, they were third last week—now they’re sixth. A pretty big swing given this chart is for the whole season so far.
Goaltending galore
It’s always entertaining to see how goaltending goes week over week. From outstanding performances to game-winning saves, there is no lack of action in the NHL’s goaltending world.
Stay tuned over the coming weeks to see who’s next to stack their pads to the top of the GSAx list.
Check out the past GSAx charts here.
Week 1 | 2 | 3 | 4 | 5

Want to go to the next game? Take advantage of this exclusive SeatGeek code for $20 off! Use the promo code “WINCOLUMNCGY” when you checkout!